
You won’t hear Wall Street analysts say it. You won’t hear shareholders say it. And you certainly won’t hear management teams say it.
Big tech stocks are overvalued.
Still, that only matters when the market cares. And perhaps it is starting to.
Michael Burry, the hedge fund investor portrayed by actor Christian Bale in the movie The Big Short, is in the news again, doing what he does best. He’s making waves by calling out what he believes to be investments with major risk of loss attached.
Why Michael Burry Is Thinking Differently This Time
The difference in 2025 versus 2008: Burry’s not trying to exploit weakness in the credit markets. He’s going after some of the biggest stocks in the world.
As reported here at Barchart, Burry has been quite vocal recently, sounding the alarm about not only rich valuations on big tech stocks, but also accusing them of inflating profits. It is hard to deny there has been some opacity in the nature of several deals recently, the common denominator of which is an increased collaboration between different parts of the AI “food chain.”
Burry’s focus has been on two Magnificent 7 stocks and two other giant tech firms. Let’s look at all four on the basis of their charts, and see what they tell us. Note that since tech in general has pulled back in recent weeks, I’ll skip the daily charts and use weeklies.
Because I want to see if there is more to this than what we’ve been accustomed to seeing: The stock market dives for a day or two, then comes right back. So my view is that until buy the dip is clearly past-tense, this is more about a choppy stock market price trend. Oh, I think it’s bad, and getting worse. But we’ve had too many false alarms to assume that any particular down week is the start of a trend.
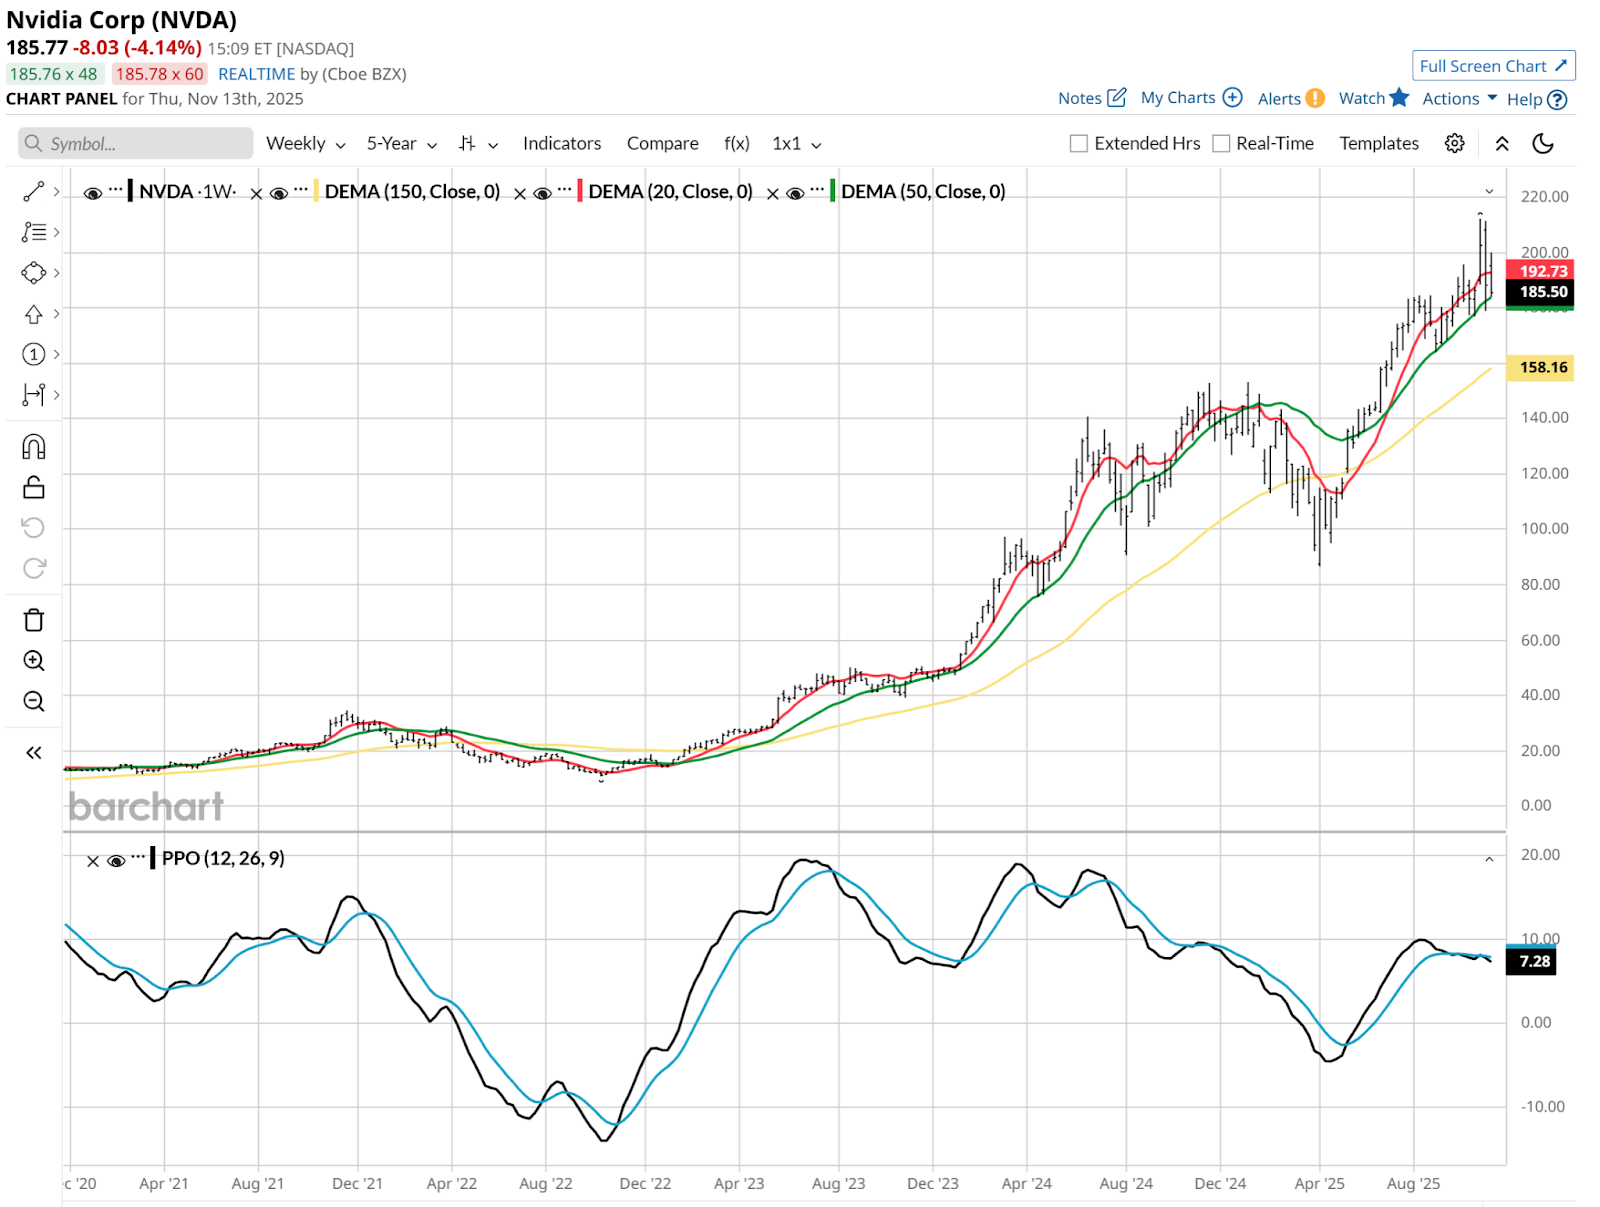
Stock #1: Nvidia
Nvidia (NVDA) has earnings due next Wednesday, Nov. 19. My question is this: Will it matter by then? There are still a few trading days until then. And in the way the market often buys into mega-cap earnings, the opposite is happening currently. That’s something to keep in mind.
This weekly chart looks like the market indexes. That should not surprise anyone, since NVDA is more than 8% of the S&P 500 Index ($SPX). As it goes, so goes the market, at least beyond a trader’s time frame. This looks very neutral to me, so perhaps earnings day next week will produce an outsized move.
In which direction? Ask the liquidity lords. They are the ones in charge right now. As always, it will be about the reaction, not the earnings data itself.
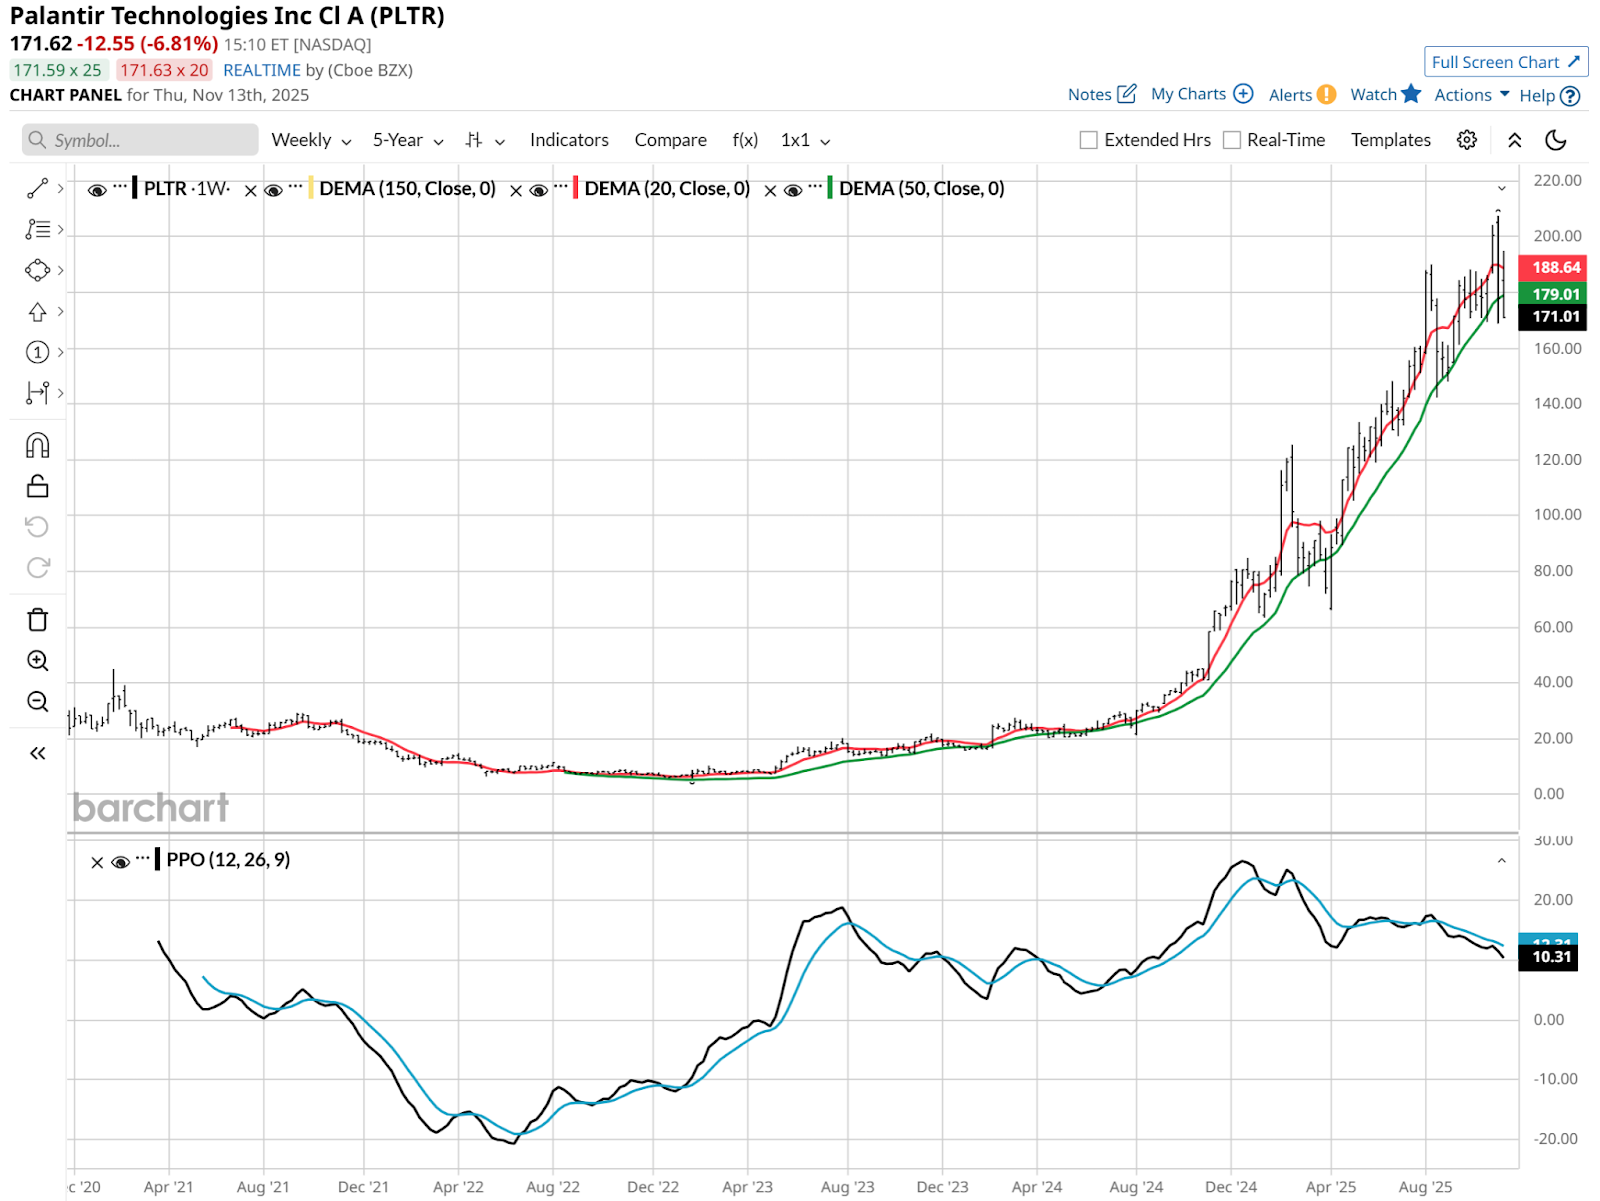
Stock #2: Palantir
Alex Karp, Palantir’s (PLTR) vocal CEO, was the opposite of silent upon learning of Mr. Burry’s take on his stock. That’s all good chatter for social gatherings, but the chart is the reality. And it looks more than just a head-cold kind of sickness to me. It looks ready to topple over. The Percentage Price Oscillator (PPO) continues to make lower lows. That’s not good, and when it is paired with a stock selling at a nosebleed multiple, that’s even worse.
This is a weekly chart, so these comments are best taken to be looking out over the next 2-4 months or so. These weekly patterns often take a while, as the tug of war battles among shorter-term charts resolve themselves.
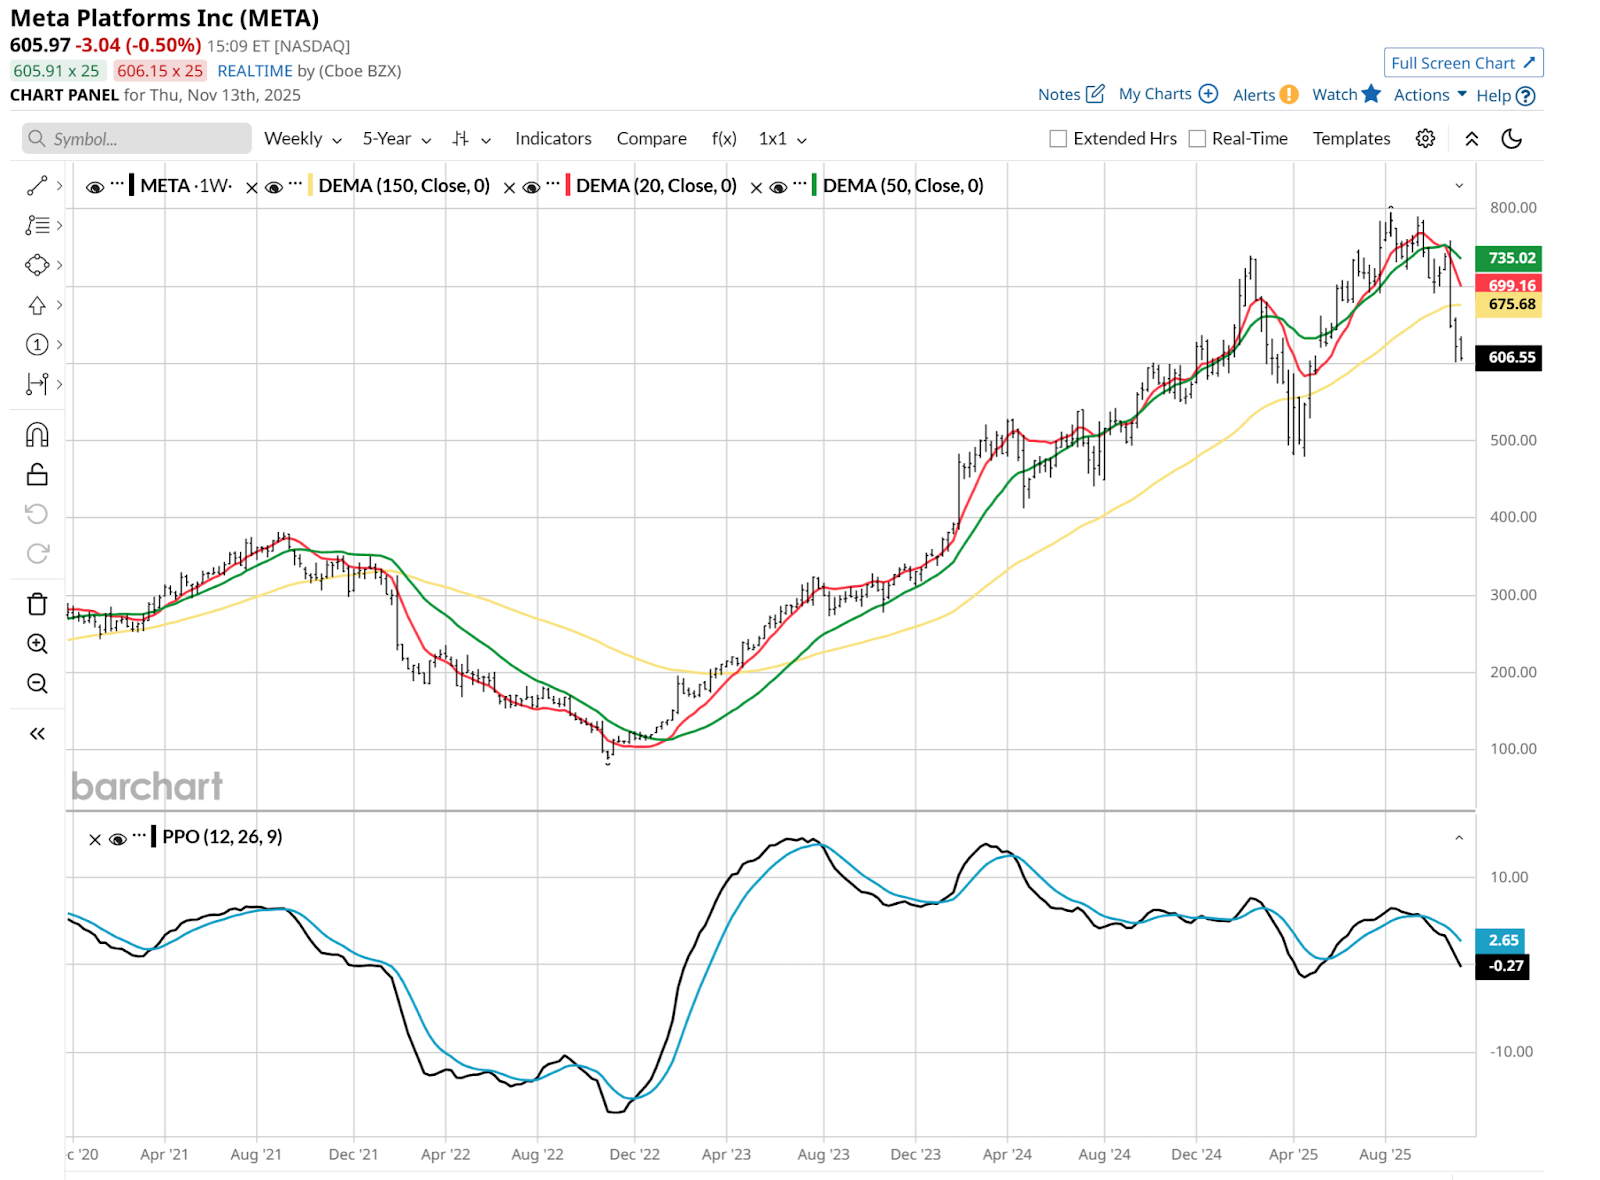
Stock #3: Meta Platforms
Meta (META) looks to be where PLTR caught its own current bug. The stock is nearly flat for 2025 now, and it headed south before the others started to catch up. Its 20-week moving average was the tipoff, with META off about 20% since it first rolled over earlier this year. Until that momentum breaks in a sustained fashion, the path of least resistance is down.
Does that mean that this or any other stock can’t rally, or even bottom here? No. It just means that the likelihood of that occurring is more like a longshot than a layup, to mix sports metaphors.
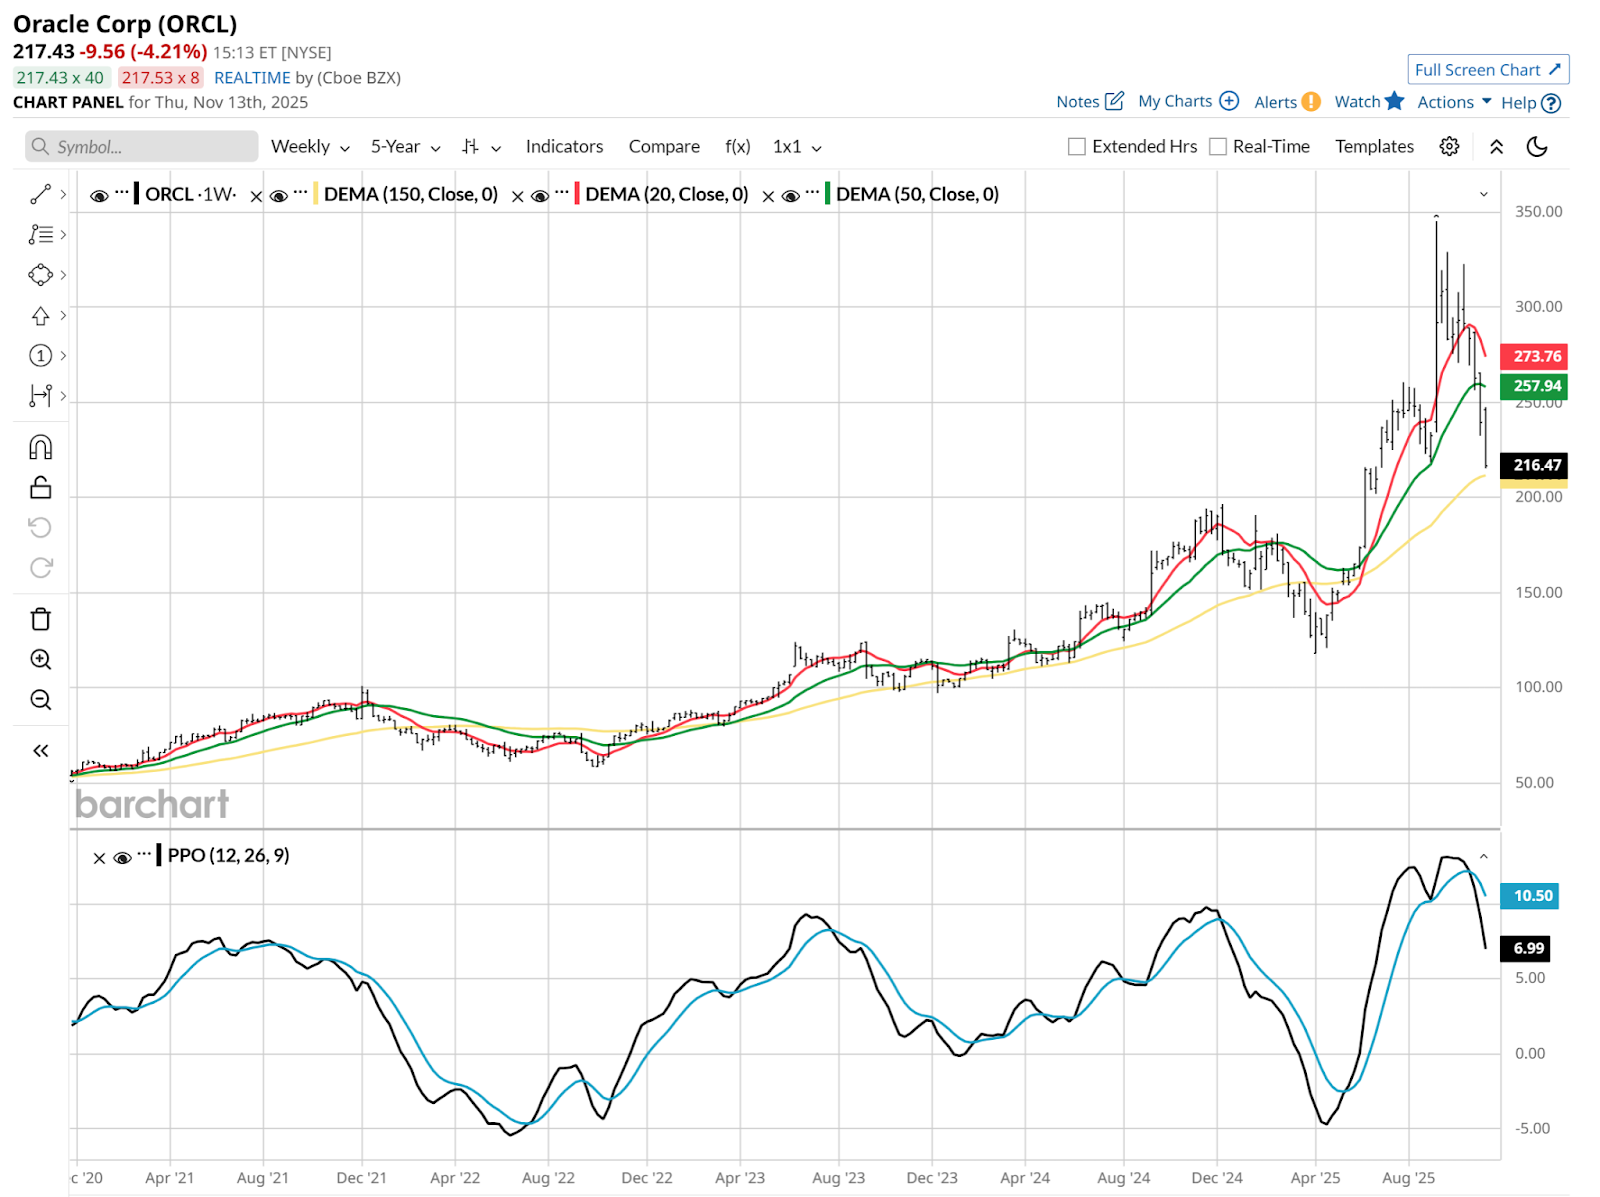
Stock #4: Oracle
Oracle (ORCL) has been its own little soap opera, hasn’t it? First the 30%-plus move in a day, then a not-so-subtle decline. And now, Michael Burry has entered the conversation. And other tech stocks are fading.
This all adds up to another situation where, while reward is always possible, risk remains extremely high. As it did at $345, ORCL’s all-time high, which seemed like just a week ago. Fact check: it was Sept. 10, all of 9 weeks ago.
Good Grief, Stock Market!
Michael Burry is back at it, expressing cryptic and not-so-cryptic warnings to inventors. This time, he no longer has an operating hedge fund, but he does have a much more influential platform. Thanks to a great movie, with a star-studded cast.
That was a movie about 2008, and this is late 2025, in the midst of an epic stock market rally. So, what’s next?
Look for signs that the most leveraged investors are getting margin calls. Then a big hedge fund or two blows up, or even a bank. Then, we’ll know it’s really on. Until then, my heart says “much lower soon,” but my head says “don’t be like Charlie Brown kicking the football, with Lucy pulling it away each time.”
On the date of publication, Rob Isbitts did not have (either directly or indirectly) positions in any of the securities mentioned in this article. All information and data in this article is solely for informational purposes. For more information please view the Barchart Disclosure Policy here.
More news from Barchart
- Who Is Phil Clifton? Michael Burry Names Successor as Famed Investor Deregisters Hedge Fund.
- Michael Burry Slams NVDA, PLTR, META, ORCL. Here’s What the Charts Say About His Tech-Focused ‘Big Short.’
- Get Ready for a Short Squeeze in Sweetgreen Stock
- Stablecoin Issuer Circle Faces ‘an Uphill Battle.’ Is It Time to Give Up on CRCL Stock?