
– Secures Convertible Debt Financing; Initial Tranche of $15 Million in Cash With Option to Raise Additional Capital Up to $90 Million Total to Maintain Healthy Cash Floor and Fund Growth –
– Executes Non-Binding Term Sheet for an Additional $20 Million of Equipment Financing, Bringing Total CapFormer Equipment Financing to Approximately $30 Million –
– Maintains Revenue and Run-Rate Adjusted EBITDA Guidance, Strong Customer Demand, and CapFormer Build-Out Timeline –
Origin Materials, Inc. (“Origin,” “Origin Materials,” or the “Company”) (Nasdaq: ORGN, ORGNW), a technology company with a mission to enable the world’s transition to sustainable materials, today announced financial results for its third quarter ended September 30, 2025.
This press release features multimedia. View the full release here: https://www.businesswire.com/news/home/20251113312952/en/
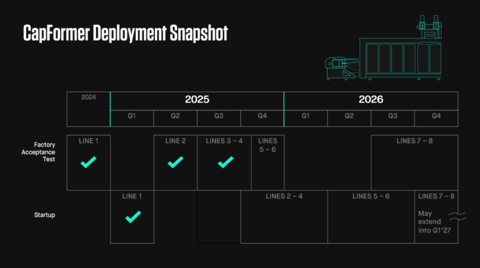
Origin Materials CapFormer Deployment Snapshot
Commentary from John Bissell, Origin CEO and Co-Founder:
“Today, we are announcing financing that strengthens our balance sheet and provides access to additional capital that can be staged according to our manufacturing capacity build-out. This financing fuels the scale-up of PET cap production to serve forthcoming volume orders pursuant to customer qualification. Our financing is composed of debt financing, both equipment backed and corporate level debt, with the flexibility to optimize cash management and cost of capital by optionally servicing the debt with equity. Following our evaluation of multiple corporate financing structures over the past couple of quarters, we have executed a secured convertible debt facility, with an initial close of $15 million in cash by end of month, with the capacity for additional tranches, up to a total of $90 million, as needed to maintain a healthy cash floor and fund growth. Also in the fourth quarter, we signed a non-binding term sheet expected to close within 30 days which will add $20 million in additional equipment financing capacity, bringing our total equipment financing capacity to approximately $30 million.”
“In addition to achieving financing milestones, this quarter we continued to execute our operating plan: our CapFormer deployment schedule is on track, and we are maintaining our related guidance. Last quarter, in California we put our closures on what we believe are the only beverage products on the market with PET caps. Since then, we’ve built sales momentum globally, marketing our products in North America, Europe, South America, and Asia, and bolstering our customer pipeline in accordance with our ‘water first’ growth strategy. And, our customer Berlin Packaging placed its first order. In recent months, our sales team displayed PET caps at key international conferences for plastic parts and the beverage industry, and it is clear that Origin holds a strong lead in PET cap commercialization.”
“We extended our technology lead this quarter by making progress with two priority challenges: impact resistance and multi-day heated horizontal stress testing. Amongst separate cap designs, we successfully exceeded performance requirements for both of these tests. In upcoming production trials, we expect to consolidate these features into a single cap design.”
“For those new to Origin, we are making a big difference with a small cap and the technology behind it. Our technology platform produces what we believe are the only commercial-ready PET caps, as opposed to the HDPE and polypropylene caps which today dominate the over $65 billion closures market. Our platform excels in seven areas: recyclability, oxygen and CO2 barrier (enabling shelf-life), closure diameter (enabling more economic large formats), thickness (enabling lighter weight), rigidity (premium feel), use of recycled content, and optical clarity. We look forward to continuing customer qualifications, beginning with flat water and expanding into pressurized water, CSD, and other formats.”
Company Third Quarter and Recent Business Highlights
Financing and Strategic Highlights:
- Executed a secured convertible debt facility, with an initial close of $15 million in cash by end of month, with the capacity for additional tranches, up to a total of $90 million, as needed to maintain a healthy cash floor and fund growth. Additional information about the debt facility, including the terms of the Note and Securities Purchase Agreement, will be filed with the SEC on a Current Report on Form 8-K.
- We are also announcing a non-binding term sheet for an additional equipment financing of $20 million, bringing total CapFormer equipment financing to approximately $30 million. The new equipment financing is additive to the equipment financing the Company disclosed and secured in October 2025. These equipment financing facilities support five CapFormer lines, to be funded upon individual CapFormer Site Acceptance Testing.
- We will continue to pursue additional equipment financing for subsequent lines. We now expect the average of equipment financing coverage for CapFormer equipment purchases to be at the low end of our previously stated goal of 50-70% coverage, due to the increase in “soft costs” resulting from tariffs. We plan to make staged drawdowns concurrently with equipment delivery to optimize the total cost of capital.
- Origin settled securities litigation with no finding of liability or wrongdoing. Announced in October 2025, Origin entered into binding agreements to settle the shareholder class action lawsuit and the related derivative lawsuit, initially filed in August 2023 and March 2025, respectively, pending in the United States District Court for the Eastern District of California. The proposed settlement, which will be fully covered by insurance, resolves all claims asserted against Origin and the other named defendants in the lawsuits.
- Our strategic review with RBC Capital Markets, announced in our Q2 2025 earnings release, is progressing well with productive engagement from potential counterparties.
-
We are maintaining revenue and run-rate Adjusted EBITDA guidance. Before consideration of the effects of potential strategic review outcomes, we continue to expect:
- 2026: Revenue of $20 million to $30 million.
- 2027: Revenue of $100 million to $200 million.
- Adjusted EBITDA run-rate breakeven: 2027.
Commercialization Highlights:
We are executing our “water first” go-to-market strategy, with line of sight to our revenue targets in 2026 within the $65 billion global closures market. Highlights include:
- Customer order. In October 2025, Berlin Packaging placed its first order for PET caps, which Origin is fulfilling. Read about the partnership.
- Product qualification pipeline. In parallel designs iterations, we are encouraged by the performance of Origin PET caps for impact resistance testing and multi-day heated horizontal stress testing, key to qualification for CSD (carbonated soft drink) applications. We are consolidating these features showing outstanding performance into a single cap design.
- Water customer demand is strong, growing, and provides a path to CSD sales. More than half of the water brands in Origin’s customer qualification funnel are also potential CSD customers.
Production Capacity Build Highlights:
- CapFormer deployment schedule on track. We continue to expand PET cap production capability in accordance with our revenue growth strategy. We remain on track for completing Factory Acceptance Testing through Line 6 by the end of 2025. To optimize capital deployment, Line 7 and Line 8 startup could extend into Q1 2027, updated from Q4 2026.
Results for Third Quarter 2025
Cash, cash equivalents, and marketable securities were $54.3 million as of September 30, 2025.
The net accounts receivable balance of $15.5 million at September 30, 2025, is comprised of receivables associated with the Company’s legacy supply chain activation program being wound down in 2025. Concurrent with the wind-down of the supply chain activation program, we expect to collect all related net receivables in due course, resulting in a significant source of cash.
Additionally, as of September 30, 2025, the Company had $9.1 million of land held for sale in Geismar, Louisiana. We expect the sale of this land to result in an additional significant source of cash.
Revenue for the third quarter was $4.7 million compared to $8.2 million in the prior-year period, due to the planned reduction in the Company’s supply chain activation program.
Operating expenses for the third quarter were $17.1 million compared to $32.5 million in the prior-year period, a decrease of $15.4 million primarily resulting in a decrease in non-cash impairment of assets expense of $15.0 million and a decrease in research and development expenses of $1.8 million which is offset by an increase in general and administrative expenses of $1.4 million.
Net loss was $16.4 million for the third quarter compared to $36.8 million in the prior-year period, a decrease of $20.4 million primarily due to the $2.4 million greater gain in fair value of common stock warrants liability, the gain of $2.9 million in fair value of earnout liability, and a decrease of $15.4 million in operating expenses.
Adjusted EBITDA loss was $11.6 million for the third quarter compared to $12.0 million in the prior-year period.
Shares outstanding as of September 30, 2025 were 150.5 million including 1.5 million shares that are subject to forfeiture based on share price performance targets previously disclosed in our filings.
For a reconciliation of non-GAAP figures to the applicable GAAP figures, please see the table captioned ‘Reconciliation of GAAP and Non-GAAP Results' set forth at the end of this press release. We have not reconciled our guidance for non-GAAP run-rate Adjusted EBITDA to GAAP due to the uncertainty and potential variability of reconciling items such as stock-based compensation. As a result, a reconciliation is not available without unreasonable effort and we are unable to address the probable significance of the unavailable information.
Webcast and Conference Call Information
Company management will host a webcast and conference call on November 13, 2025, at 5:00 p.m. Eastern Time, to discuss the Company's financial results.
Interested investors and other parties can listen to a webcast of the live conference call and access the Company’s quarterly update presentation by logging onto the Investor Relations section of the Company's website at https://investors.originmaterials.com/.
The conference call can be accessed live over the phone by dialing +1-844-676-8020 (domestic) or +1-412-634-6957 (international). A telephonic replay will be available approximately three hours after the call by dialing 1-844-512-2921, or for international callers, +1-412-317-6671. The conference ID for the live call and pin number for the replay is 10202782. The replay will be available until 11:59 p.m. Eastern Time on November 27, 2025.
About Origin Materials, Inc.
Origin is a technology company with a mission to enable the world’s transition to sustainable materials. Our innovations include PET caps and closures that bring recycling circularity and enhanced performance to a ~$65 billion market, specialty materials, and our patented biomass conversion platform that transforms carbon into sustainable materials for a wide range of end products. For more information, visit www.originmaterials.com.
Non-GAAP Financial Information
To supplement the Company’s financial results presented in accordance with generally accepted accounting principles in the United States ("U.S. GAAP"), the Company also uses non-GAAP financial measures, including Adjusted EBITDA, as supplemental measures to review and assess the Company’s operating performance. Adjusted EBITDA is defined as net loss adjusted for (i) stock-based compensation, (ii) depreciation and amortization, (iii) impairment of assets, (iv) investment income, (v) interest expenses, (vi) change in fair value of derivatives, (vii) change in fair value of common stock warrants liability, (viii) change in fair value of earnout liability, (ix) other (income) expenses, net and (x) income tax provision.
The Company believes that the presentation of Adjusted EBITDA is appropriate to provide additional information to investors about our operating profitability adjusted for certain non-cash items, non-routine items that the Company does not expect to continue at the same level in the future, as well as other items that are not core to the Company’s operations. Further, the Company believes Adjusted EBITDA provides a meaningful measure of operating profitability because the Company uses it for evaluating the Company’s business performance, making budgeting decisions, and comparing performance against that of other peer companies using similar measures.
Non-GAAP financial measures are not defined under U.S. GAAP and are not presented in accordance with U.S. GAAP. These non-GAAP financial measures have limitations as analytical tools, and when assessing the Company’s operating performance, investors should not consider them in isolation. In addition, calculations of this non-GAAP financial information may be different from calculations used by other companies, and therefore comparability may be limited.
The Company mitigates these limitations by reconciling the non-GAAP financial measures to the most comparable U.S. GAAP performance measures, all of which should be considered when evaluating our performance.
For more information on Adjusted EBITDA, please see the table captioned “Reconciliation of GAAP and Non-GAAP Results” set forth at the end of this press release.
Cautionary Note on Forward-Looking Statements
This press release contains certain forward-looking statements within the meaning of the federal securities laws. Forward-looking statements generally are accompanied by words such as “believe,” “may,” “will,” “estimate,” “continue,” “anticipate,” “intend,” “expect,” “should,” “would,” “plan,” “predict,” “project,” “potential,” “seem,” “seek,” “target,” “future,” “outlook,” and similar expressions that predict or indicate future events or trends or that are not statements of historical matters. These forward-looking statements include, but are not limited to, statements regarding the timing and closing of the secured convertible debt financing and additional equipment financing agreements; Origin’s business strategy, commercial, operating, and product development plans and announcements of such plans, anticipated customer demand, the impact of tariffs on our business, revenue potential, the projection that Origin will achieve positive run-rate Adjusted EBITDA results by 2027, pace and anticipated timing of bringing Origin’s CapFormer lines online and anticipated revenue generated from such systems, the impact of anticipated improvements to Origin’s CapFormer lines, ability of Origin’s products to complete customer qualification on time or at all, anticipated timing of commercializing Origin’s products and delivering those products to customers, estimated total addressable market, anticipated benefits of and demand for Origin’s potential products, ability to convert potential customer interest into revenue, expectations about Origin’s future financing arrangements, including Origin’s ability to enter into financing arrangements on favorable terms, the outcome of Origin’s evaluation of strategic alternatives and the ability of such strategic alternatives to enhance shareholder value, access to manufacturing capacity, marketing and distribution capabilities, or strategic capital, or address the gap between indicated product demand and production capacity, anticipated growth and projected financial information. From time to time, the Company discloses approximate levels of customer demand based on information received from current and potential customers as to amounts of product they wish to purchase at a certain price over a certain term in the future. The Company does not discount such indications of customer demand by the likelihood of their conversion to actual revenue or the time until such conversion. Some customers may overstate the amount of product they wish to purchase and one should not assume that demand figures disclosed by the Company will necessarily translate into comparable levels of revenue. The forward-looking statements are based on various assumptions, whether or not identified in this press release, and on the current plans, objectives, estimates, expectations, and intentions of the management of Origin and are not predictions of actual performance and inherently involve significant risks and uncertainties. These forward-looking statements are provided for illustrative purposes only and are not intended to serve as, and must not be relied on as, a guarantee, an assurance, a prediction, or a definitive statement of fact or probability. Actual events and circumstances are difficult or impossible to predict and will differ from assumptions. Many actual events and circumstances are beyond the control of Origin. These forward-looking statements are subject to a number of risks and uncertainties including, but not limited to, the fact that Origin may be unable to successfully commercialize its products; the effects of competition, tariffs, and other trade restrictions on Origin’s business; the uncertainty of the projected financial information with respect to Origin, particularly given the rapidly changing tariff landscape; disruptions and other impacts to Origin’s business. Other factors that could adversely affect the Company’s operations include those discussed in Origin’s Quarterly Report on Form 10-Q filed with the U.S. Securities and Exchange Commission (“SEC”) on November 13, 2025 under the heading “Risk Factors,” and other documents Origin has filed, or will file, with the SEC. These filings, when available, are available on the investor relations section of our website at investors.originmaterials.com and on the SEC’s website at www.sec.gov. If any of these risks materialize or Origin’s assumptions prove incorrect, actual results could differ materially from the results implied by these forward-looking statements. There may be additional risks that Origin does not presently know or currently believes are immaterial that could also cause actual results to differ from those contained in the forward-looking statements. Given these risks and uncertainties, readers are cautioned not to place undue reliance on such forward-looking statements. Origin undertakes no obligation to revise or publicly release the results of any revision to these forward-looking statements, except as required under applicable law. These forward-looking statements should not be relied upon as representing Origin’s assessments of any date subsequent to the date of this press release. Accordingly, undue reliance should not be placed upon the forward-looking statements.
ORIGIN MATERIALS, INC. |
|||||||
CONDENSED CONSOLIDATED BALANCE SHEETS |
|||||||
(In thousands, except share and per share data) |
September 30,
|
|
December 31,
|
||||
ASSETS |
|
|
|
||||
Current assets |
|
|
|
||||
Cash and cash equivalents |
$ |
34,061 |
|
|
$ |
56,307 |
|
Marketable securities |
|
20,279 |
|
|
|
46,613 |
|
Accounts receivable net of allowance for credit losses of $520 and $1,230, respectively |
|
15,534 |
|
|
|
19,179 |
|
Other receivables |
|
2,456 |
|
|
|
2,526 |
|
Inventory |
|
635 |
|
|
|
866 |
|
Prepaid expenses and other current assets |
|
2,045 |
|
|
|
2,401 |
|
Land held for sale |
|
9,125 |
|
|
|
11,282 |
|
Total current assets |
|
84,135 |
|
|
|
139,174 |
|
Property, plant, and equipment, net |
|
225,744 |
|
|
|
203,919 |
|
Operating lease right-of-use asset |
|
3,270 |
|
|
|
3,735 |
|
Intangible assets, net |
|
51 |
|
|
|
73 |
|
Deferred tax assets |
|
410 |
|
|
|
621 |
|
Other long-term assets |
|
13,735 |
|
|
|
30,505 |
|
Total assets |
$ |
327,345 |
|
|
$ |
378,027 |
|
|
|
|
|
||||
LIABILITIES AND STOCKHOLDERS’ EQUITY |
|
|
|
||||
Current liabilities |
|
|
|
||||
Accounts payable |
$ |
1,922 |
|
|
$ |
2,921 |
|
Accrued expenses |
|
8,917 |
|
|
|
2,779 |
|
Operating lease liabilities, current |
|
331 |
|
|
|
323 |
|
Notes payable, short-term |
|
1,730 |
|
|
|
3,772 |
|
Other liabilities, current |
|
387 |
|
|
|
2,754 |
|
Total current liabilities |
|
13,287 |
|
|
|
12,549 |
|
Earnout liability |
|
24 |
|
|
|
2,486 |
|
Canadian Government Research and Development Program liability |
|
14,876 |
|
|
|
14,399 |
|
Common stock warrants liability |
|
518 |
|
|
|
4,566 |
|
Notes payable, long-term |
|
— |
|
|
|
1,730 |
|
Operating lease liabilities |
|
3,612 |
|
|
|
3,858 |
|
Other liabilities, long-term |
|
41 |
|
|
|
74 |
|
Total liabilities |
|
32,358 |
|
|
|
39,662 |
|
STOCKHOLDERS’ EQUITY |
|
|
|
||||
Preferred stock, $0.0001 par value, 10,000,000 shares authorized; no shares issued and outstanding as of September 30, 2025 and December 31, 2024 |
|
— |
|
|
|
— |
|
Common stock, $0.0001 par value, 1,000,000,000 shares authorized; 150,533,064 and 148,574,227, issued and outstanding as of September 30, 2025 and December 31, 2024, respectively (including 1,500,000 and 3,000,000, respectively, of Sponsor Vesting Shares) |
|
15 |
|
|
|
15 |
|
Additional paid-in capital |
|
400,253 |
|
|
|
393,186 |
|
Accumulated deficit |
|
(93,697 |
) |
|
|
(38,127 |
) |
Accumulated other comprehensive loss |
|
(11,584 |
) |
|
|
(16,709 |
) |
Total stockholders’ equity |
|
294,987 |
|
|
|
338,365 |
|
Total liabilities and stockholders’ equity |
$ |
327,345 |
|
|
$ |
378,027 |
|
ORIGIN MATERIALS, INC. |
|||||||||||||||
CONDENSED CONSOLIDATED STATEMENTS OF OPERATIONS AND COMPREHENSIVE LOSS |
|||||||||||||||
(Unaudited) |
|||||||||||||||
|
Three Months Ended September 30, |
|
Nine Months Ended September 30, |
||||||||||||
(In thousands, except share and per share data) |
|
2025 |
|
|
|
2024 |
|
|
|
2025 |
|
|
|
2024 |
|
Revenues: |
|
|
|
|
|
|
|
||||||||
Products |
$ |
4,657 |
|
|
$ |
8,202 |
|
|
$ |
15,900 |
|
|
$ |
22,057 |
|
Services |
|
— |
|
|
|
— |
|
|
|
— |
|
|
|
3 |
|
Total revenues |
|
4,657 |
|
|
|
8,202 |
|
|
|
15,900 |
|
|
|
22,060 |
|
Cost of revenues (exclusive of depreciation and amortization shown separately below) |
|
4,500 |
|
|
|
8,141 |
|
|
|
15,448 |
|
|
|
21,654 |
|
Operating expenses: |
|
|
|
|
|
|
|
||||||||
Research and development |
|
3,328 |
|
|
|
5,127 |
|
|
|
9,907 |
|
|
|
15,338 |
|
General and administrative |
|
10,717 |
|
|
|
9,347 |
|
|
|
29,916 |
|
|
|
30,611 |
|
Depreciation and amortization |
|
2,836 |
|
|
|
2,822 |
|
|
|
8,332 |
|
|
|
7,946 |
|
Impairment of assets |
|
210 |
|
|
|
15,170 |
|
|
|
16,820 |
|
|
|
15,170 |
|
Total operating expenses |
|
17,091 |
|
|
|
32,466 |
|
|
|
64,975 |
|
|
|
69,065 |
|
Loss from operations |
|
(16,934 |
) |
|
|
(32,405 |
) |
|
|
(64,523 |
) |
|
|
(68,659 |
) |
Other income (expenses): |
|
|
|
|
|
|
|
||||||||
Investment income |
|
873 |
|
|
|
1,745 |
|
|
|
3,208 |
|
|
|
5,447 |
|
Interest expenses |
|
(27 |
) |
|
|
(86 |
) |
|
|
(106 |
) |
|
|
(313 |
) |
Gain (loss) in fair value of derivatives |
|
17 |
|
|
|
(43 |
) |
|
|
(15 |
) |
|
|
237 |
|
Gain (loss) in fair value of common stock warrants liability |
|
163 |
|
|
|
(2,285 |
) |
|
|
4,048 |
|
|
|
(2,913 |
) |
Gain (loss) in fair value of earnout liability |
|
— |
|
|
|
(2,941 |
) |
|
|
2,462 |
|
|
|
(2,401 |
) |
Other expenses, net |
|
(396 |
) |
|
|
(517 |
) |
|
|
(387 |
) |
|
|
(1,170 |
) |
Total other income (expenses), net |
|
630 |
|
|
|
(4,127 |
) |
|
|
9,210 |
|
|
|
(1,113 |
) |
Loss before income tax provision |
|
(16,304 |
) |
|
|
(36,532 |
) |
|
|
(55,313 |
) |
|
|
(69,772 |
) |
Income tax provision |
|
(78 |
) |
|
|
(231 |
) |
|
|
(257 |
) |
|
|
(403 |
) |
Net loss |
$ |
(16,382 |
) |
|
$ |
(36,763 |
) |
|
$ |
(55,570 |
) |
|
$ |
(70,175 |
) |
Other comprehensive income (loss): |
|
|
|
|
|
|
|
||||||||
Unrealized gain on marketable securities |
$ |
311 |
|
|
$ |
690 |
|
|
$ |
694 |
|
|
$ |
2,210 |
|
Foreign currency translation adjustment |
|
(2,509 |
) |
|
|
1,828 |
|
|
|
4,431 |
|
|
|
(3,707 |
) |
Total other comprehensive (loss) income |
|
(2,198 |
) |
|
|
2,518 |
|
|
|
5,125 |
|
|
|
(1,497 |
) |
Total comprehensive loss |
$ |
(18,580 |
) |
|
$ |
(34,245 |
) |
|
$ |
(50,445 |
) |
|
$ |
(71,672 |
) |
Net loss per share, basic |
$ |
(0.11 |
) |
|
$ |
(0.26 |
) |
|
$ |
(0.38 |
) |
|
$ |
(0.49 |
) |
Net loss per share, diluted |
$ |
(0.11 |
) |
|
$ |
(0.26 |
) |
|
$ |
(0.38 |
) |
|
$ |
(0.49 |
) |
Weighted-average common shares outstanding, basic |
|
149,340,474 |
|
|
|
143,387,618 |
|
|
|
147,399,111 |
|
|
|
142,720,941 |
|
Weighted-average common shares outstanding, diluted |
|
149,340,474 |
|
|
|
143,387,618 |
|
|
|
147,399,111 |
|
|
|
142,720,941 |
|
|
|
|
|
|
|
|
|
||||||||
ORIGIN MATERIALS, INC. |
|||||||
CONDENSED CONSOLIDATED STATEMENTS OF CASH FLOWS |
|||||||
(Unaudited) |
|||||||
|
Nine Months Ended September 30, |
||||||
(in thousands) |
|
2025 |
|
|
|
2024 |
|
Cash flows from operating activities |
|
|
|
||||
Net loss |
$ |
(55,570 |
) |
|
$ |
(70,175 |
) |
Adjustments to reconcile net loss to net cash used in operating activities: |
|
|
|
||||
Depreciation and amortization |
|
8,332 |
|
|
|
7,946 |
|
Provision for credit losses |
|
559 |
|
|
|
730 |
|
Stock-based compensation |
|
6,814 |
|
|
|
7,776 |
|
Loss on reserves |
|
— |
|
|
|
639 |
|
Impairment of assets |
|
16,820 |
|
|
|
15,170 |
|
Realized loss on marketable securities |
|
258 |
|
|
|
359 |
|
Amortization of premium and discount of marketable securities, net |
|
(92 |
) |
|
|
(172 |
) |
Change in fair value of derivative |
|
15 |
|
|
|
(237 |
) |
Change in fair value of common stock warrants liability |
|
(4,048 |
) |
|
|
2,913 |
|
Change in fair value of earnout liability |
|
(2,462 |
) |
|
|
2,401 |
|
Deferred tax provision |
|
211 |
|
|
|
375 |
|
Other non-cash expenses |
|
615 |
|
|
|
408 |
|
Changes in operating assets and liabilities: |
|
|
|
||||
Accounts receivable net and other receivables |
|
3,155 |
|
|
|
(4,256 |
) |
Inventory |
|
231 |
|
|
|
(78 |
) |
Prepaid expenses and other current assets |
|
131 |
|
|
|
962 |
|
Other long-term assets |
|
160 |
|
|
|
(4,873 |
) |
Accounts payable |
|
(127 |
) |
|
|
(124 |
) |
Accrued expenses |
|
1,267 |
|
|
|
(3,082 |
) |
Operating lease liability |
|
(242 |
) |
|
|
(298 |
) |
Other liabilities, current |
|
134 |
|
|
|
(1,507 |
) |
Other liabilities, long-term |
|
(33 |
) |
|
|
— |
|
Net cash used in operating activities |
|
(23,872 |
) |
|
|
(45,123 |
) |
Cash flows from investing activities |
|
|
|
||||
Purchases of property, plant, and equipment |
|
(21,098 |
) |
|
|
(5,117 |
) |
Proceeds from land held for sale |
|
2,117 |
|
|
|
— |
|
Purchases of marketable securities |
|
(846,217 |
) |
|
|
(1,518,398 |
) |
Sales of marketable securities |
|
861,347 |
|
|
|
1,456,532 |
|
Maturities of marketable securities |
|
11,730 |
|
|
|
86,441 |
|
Net cash provided by investing activities |
|
7,879 |
|
|
|
19,458 |
|
Cash flows from financing activities |
|
|
|
||||
Payment of notes payable |
|
(6,272 |
) |
|
|
(4,793 |
) |
Proceeds from Canadian Government Research and Development Program |
|
— |
|
|
|
8,097 |
|
Proceeds from exercise of stock options |
|
253 |
|
|
|
245 |
|
Net cash (used in) provided by financing activities |
|
(6,019 |
) |
|
|
3,549 |
|
Effects of foreign exchange rate changes on the balance of cash and cash equivalents held in foreign currencies |
|
(234 |
) |
|
|
3,010 |
|
Net decrease in cash and cash equivalents |
|
(22,246 |
) |
|
|
(19,106 |
) |
Cash and cash equivalents beginning of the period |
|
56,307 |
|
|
|
75,502 |
|
Cash and cash equivalents end of the period |
$ |
34,061 |
|
|
$ |
56,396 |
|
Origin Materials, Inc. |
|||||||||||||||
Reconciliation of GAAP and Non-GAAP Results |
|||||||||||||||
|
Three months ended September 30, |
|
Nine months ended September 30, |
||||||||||||
(in thousands) |
|
2025 |
|
|
|
2024 |
|
|
|
2025 |
|
|
|
2024 |
|
Net loss |
$ |
(16,382 |
) |
|
$ |
(36,763 |
) |
|
$ |
(55,570 |
) |
|
$ |
(70,175 |
) |
Stock-based compensation |
|
2,245 |
|
|
|
2,459 |
|
|
|
6,814 |
|
|
|
7,776 |
|
Depreciation and amortization |
|
2,836 |
|
|
|
2,822 |
|
|
|
8,332 |
|
|
|
7,946 |
|
Impairment of assets |
|
210 |
|
|
|
15,170 |
|
|
|
16,820 |
|
|
|
15,170 |
|
Investment income |
|
(873 |
) |
|
|
(1,745 |
) |
|
|
(3,208 |
) |
|
|
(5,447 |
) |
Interest expenses |
|
27 |
|
|
|
86 |
|
|
|
106 |
|
|
|
313 |
|
(Gain) loss in fair value of derivatives |
|
(17 |
) |
|
|
43 |
|
|
|
15 |
|
|
|
(237 |
) |
(Gain) loss in fair value of common stock warrants liability |
|
(163 |
) |
|
|
2,285 |
|
|
|
(4,048 |
) |
|
|
2,913 |
|
(Gain) loss in fair value of earnout liability |
|
— |
|
|
|
2,941 |
|
|
|
(2,462 |
) |
|
|
2,401 |
|
Other expenses, net |
|
396 |
|
|
|
517 |
|
|
|
387 |
|
|
|
1,170 |
|
Income tax provision |
|
78 |
|
|
|
231 |
|
|
|
257 |
|
|
|
403 |
|
Adjusted EBITDA |
$ |
(11,643 |
) |
|
$ |
(11,954 |
) |
|
$ |
(32,557 |
) |
|
$ |
(37,767 |
) |
View source version on businesswire.com: https://www.businesswire.com/news/home/20251113312952/en/
Contacts
Origin Materials
Investors:
ir@originmaterials.com
Media:
media@originmaterials.com